See the bigger picture with Residual Value Intelligence
Holistic view of the European market
Autovista Group is uniquely positioned to offer a pan-European view of the automotive market. Our new service will capitalise on this strength, initially focusing on seven European markets.
Put trends into context using data dashboards to track performance across countries as well as by segment, fuel type and brands.
Numbers you can trust
Built on Autovista's highly regarded pricing and specification datasets, this new service will ensure you benefit from:
- trusted forecasts and valuations based on a transparent methodology
- trend analysis based on a robust segmentation structure
- reliable fully weighted averages to facilitate useful cross-country comparisons
Monitor what's really happening
The future of diesel is coming under intense scrutiny and this is already having a major impact on manufacturer's R&D strategies.
Monitor this and other industry-changing trends playing out across Europe in the used car market. Review your tactics to ensure you manage risk appropriately and can effectively maximise your revenue and profit.
Get access to our comprehensive datasets
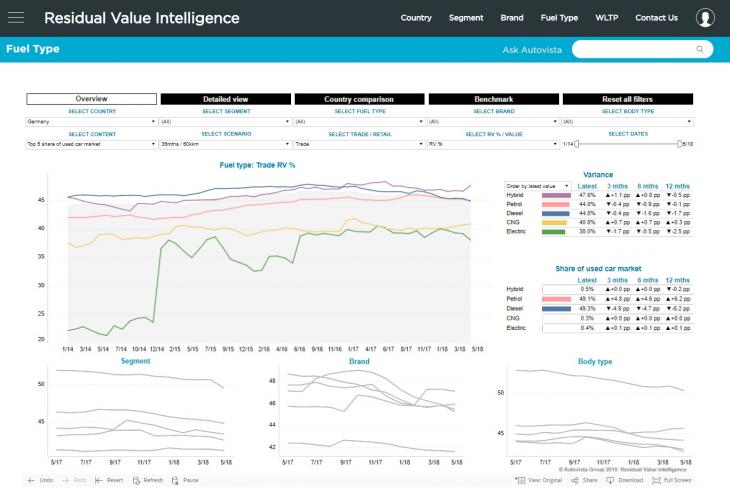
This is an example of our Fuel dashboard, which you can filter by fuel type, scenario, segment, brand, body-type, by trade or retail values. You can also interrogate our dashboards on Brands, Segments and each of the seven countries.
For more information, request a demonstration from our team.
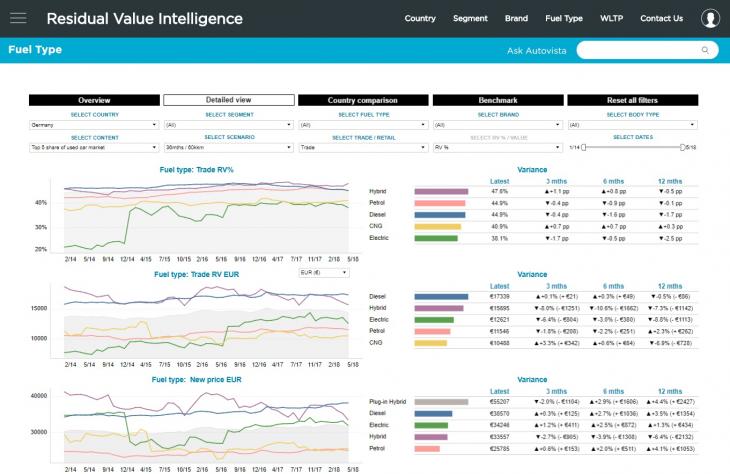
For a more detailed view you can see residual value in local currency (in Euros or Pounds Sterling) as well as RV%. This and the new price history go back to the beginning of 2017. You can also compare performance across seven countries or benchmark two specific fuels by percentage point difference.
Features & benefits
Review trends and give real context to your own internal analysis by interrogating our dashboards on:
- 7 markets
- 14 segments
- 7 fuel types
- 42 brands
Residual Value Intelligence tracks all the key performance indicators so that you gain a deeper insight into the numbers:
- monitor current and forecast values across trade and retail
- review different scenarios to improve strategic planning
- 16 age-distance scenarios available as standard
Intuitive, easy to use and share so that you can spend more time on analysis and action:
- uses Tableau, the leading visualisation software in the market
- see all the key data at a glance in each dashboard
- download graphs and dashboards for presentations or to share with colleagues

